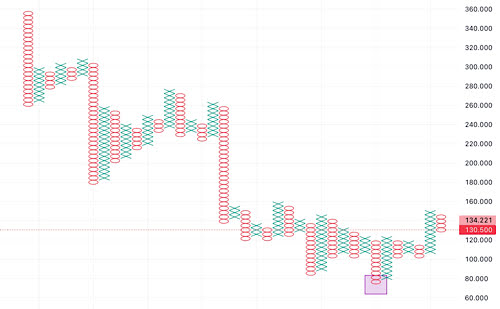
The one above shows the evolution of the USD/JPY from the 70s till today. Why are we writing about the Japanese yen? We have received many questions about this pair. Some asked us because they were thinking of moving there, and others in relation to buying real estate in Japan.
The most important aspect of the chart is marked with a square: a powerful bear trap. After that we can see the beginning of bullish movement that will very likely continue. Our target prices are first 160 and then 180.

